10 Year - 2 Year Treasury Spread (Latest Data - 10/16/26)

Negative spread equals negative sentiment. Investors have more faith in the economy 2 years from now than 10 years from now.

Macro charts for the people. Free, Open, & Current.
Click on each chart's picture to dive deeper, hover over each to learn a bit more.
A series of graphs evaluating the pressure and dynamics of the general economy.
Negative spread equals negative sentiment. Investors have more faith in the economy 2 years from now than 10 years from now.
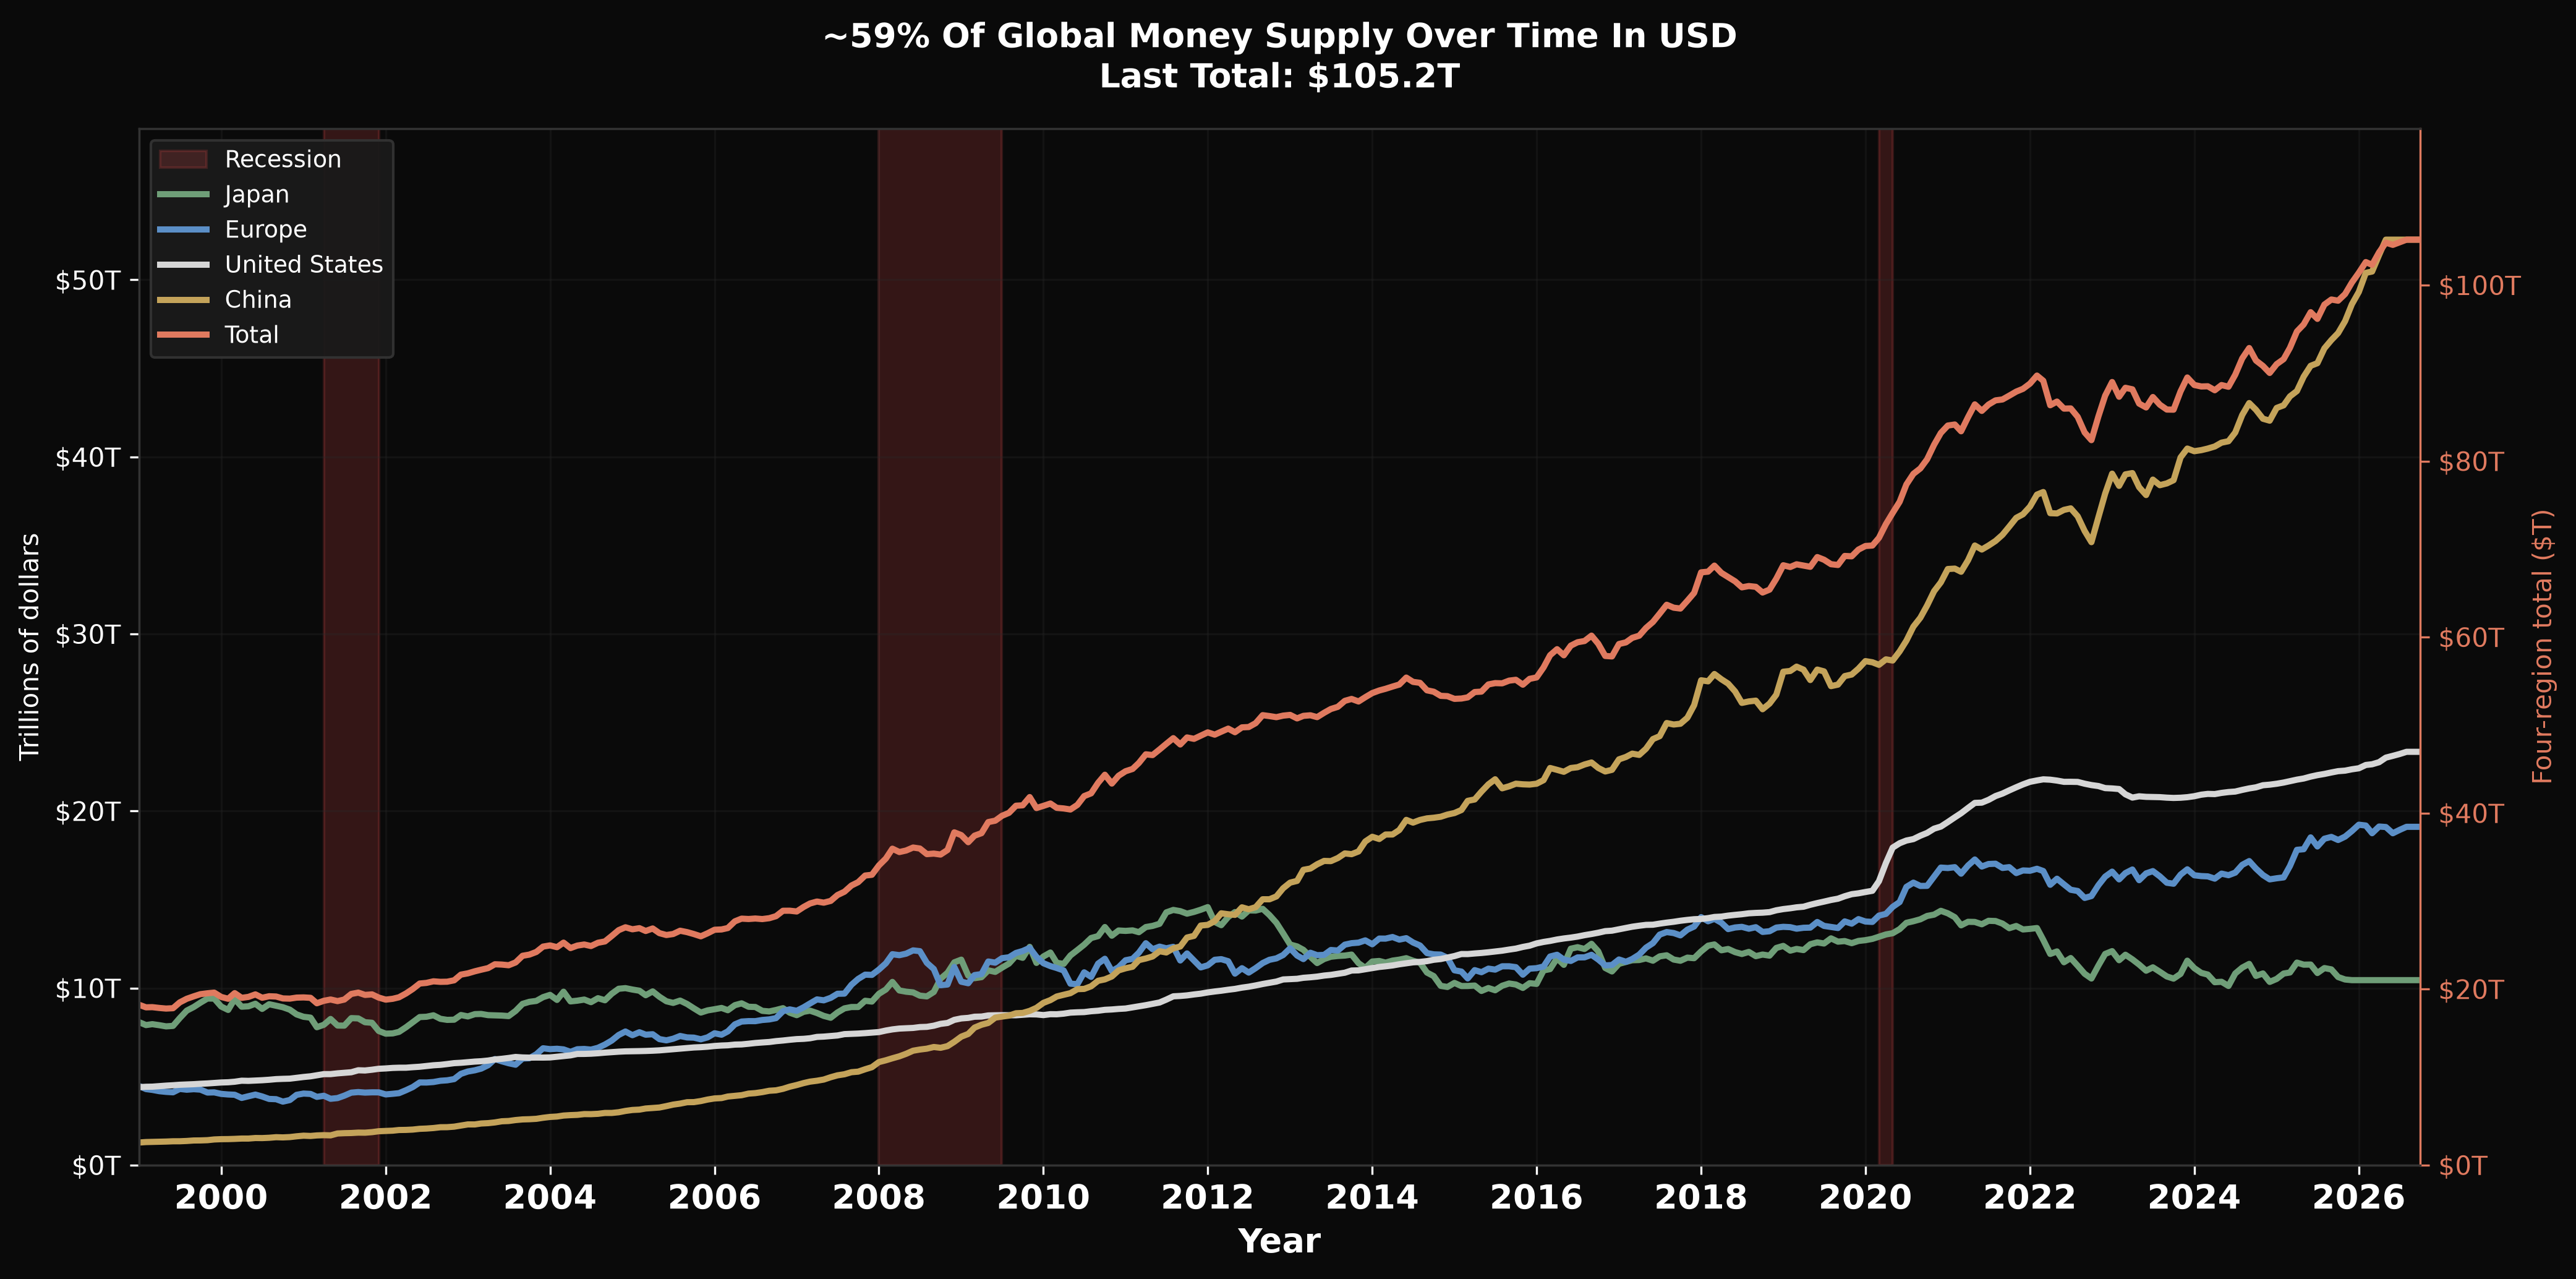
US, Europe, China, and Japan money in dollars. Orange line is the four-region total. About 59% of global money supply.
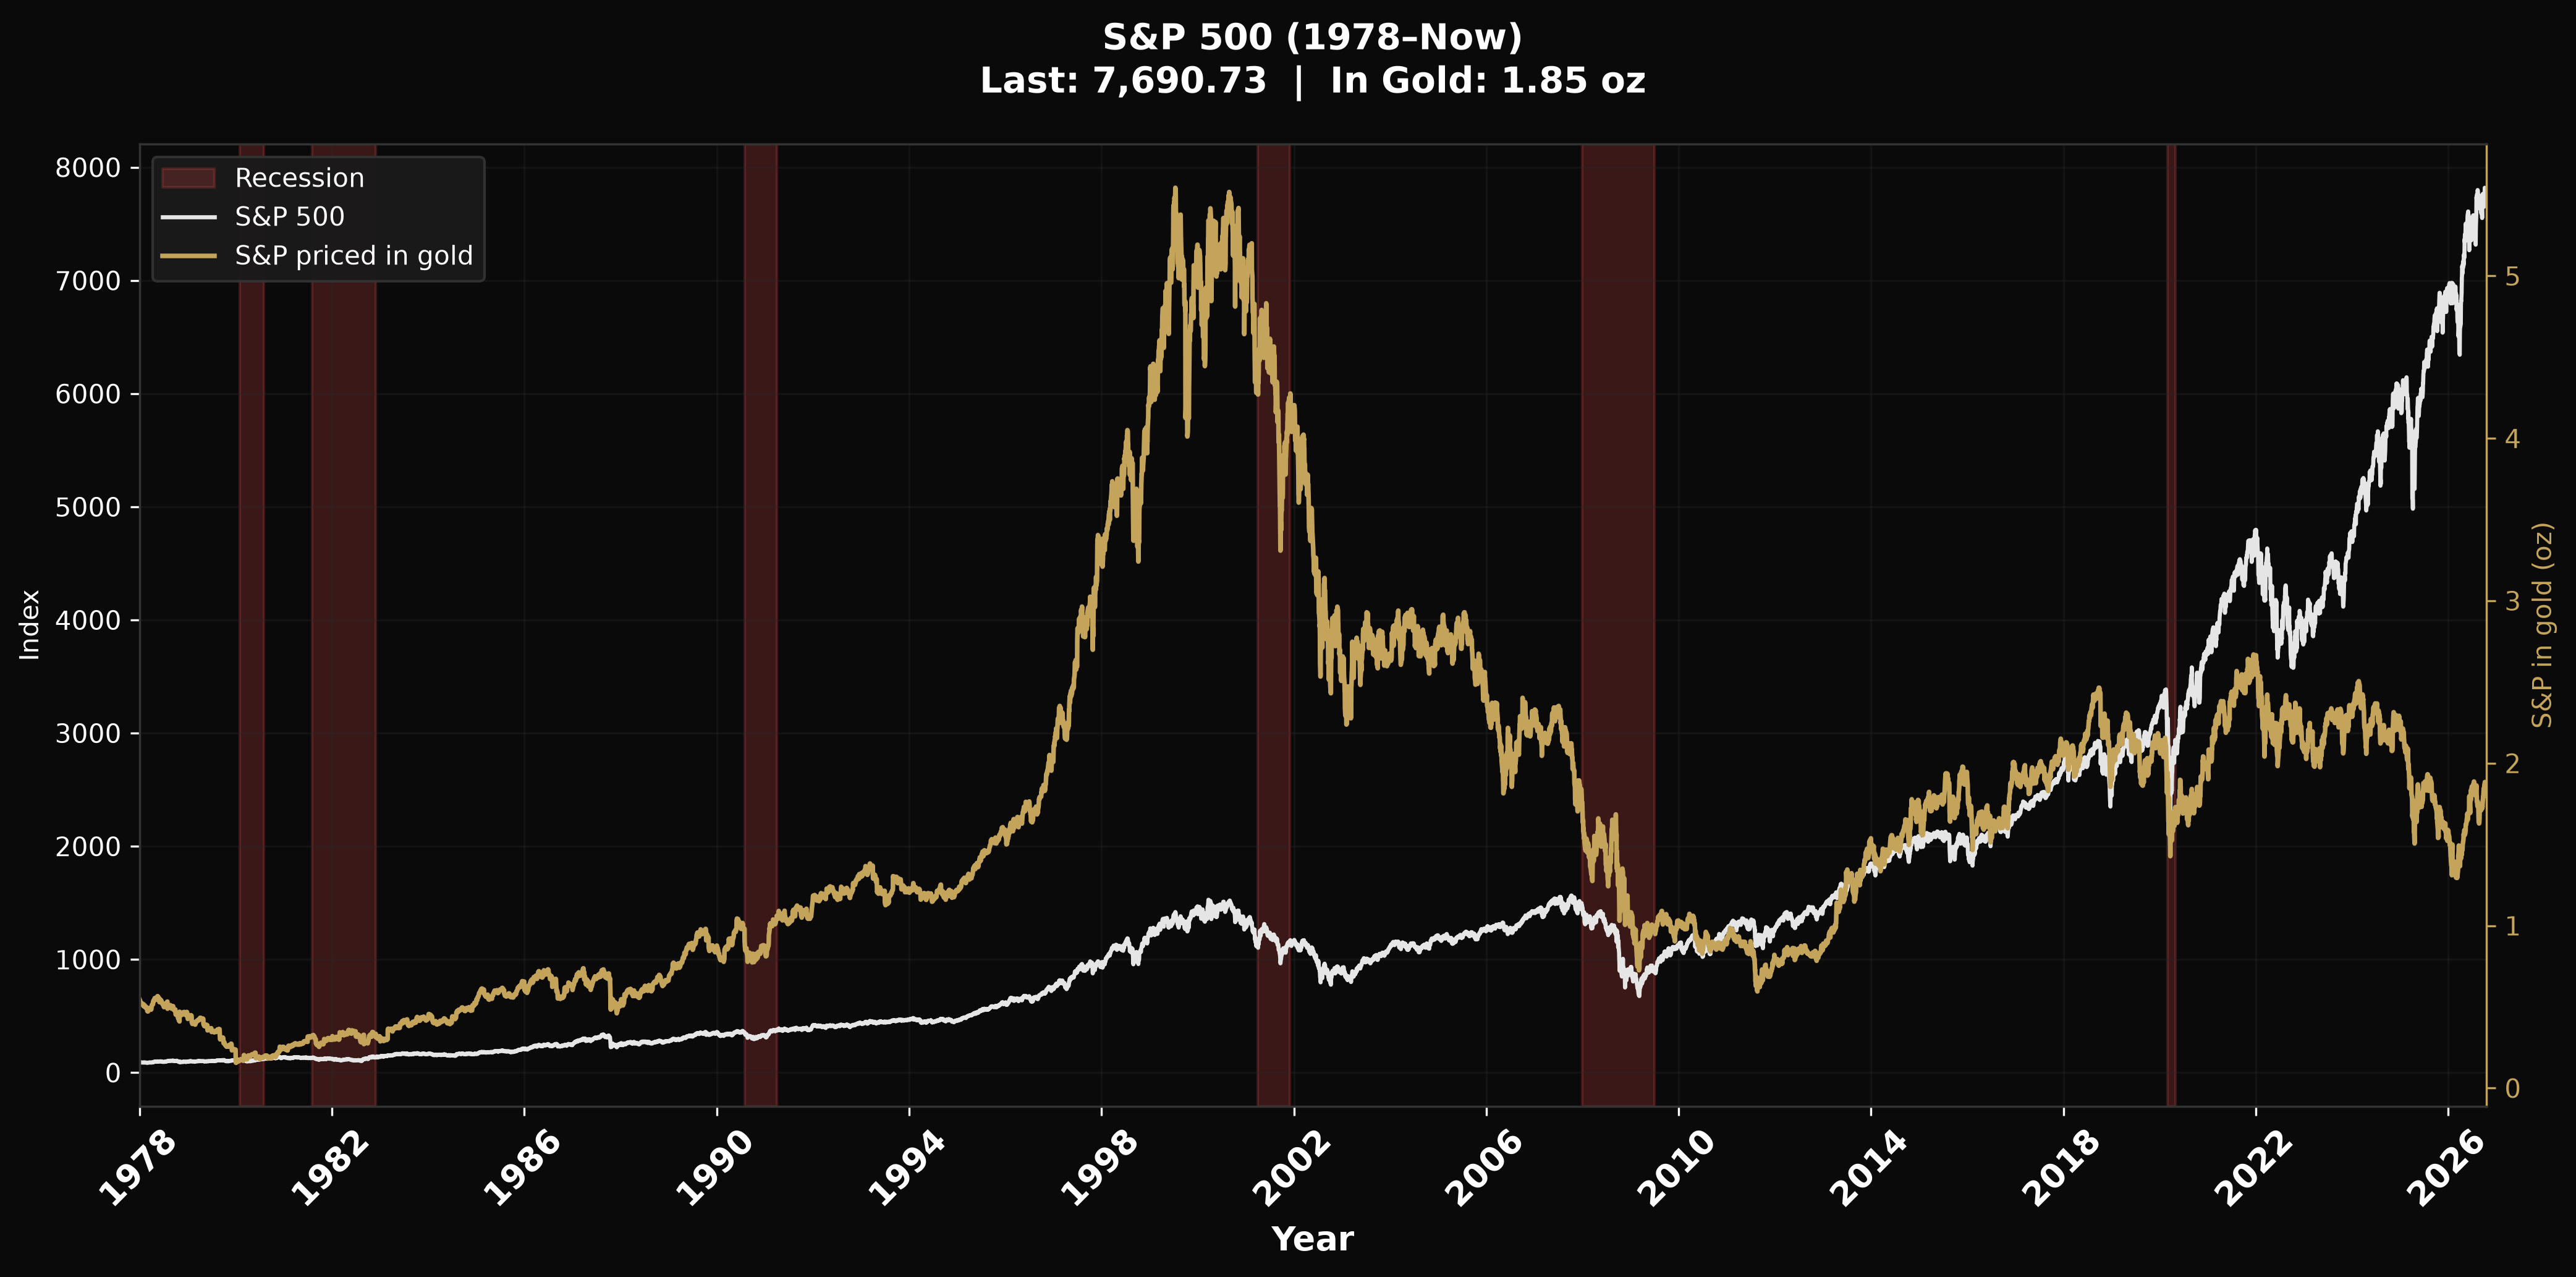
White is the S&P 500 in dollars. Gold is the same index priced in ounces of gold. When the gold line falls, stocks are losing to metal even if the dollar index looks fine.
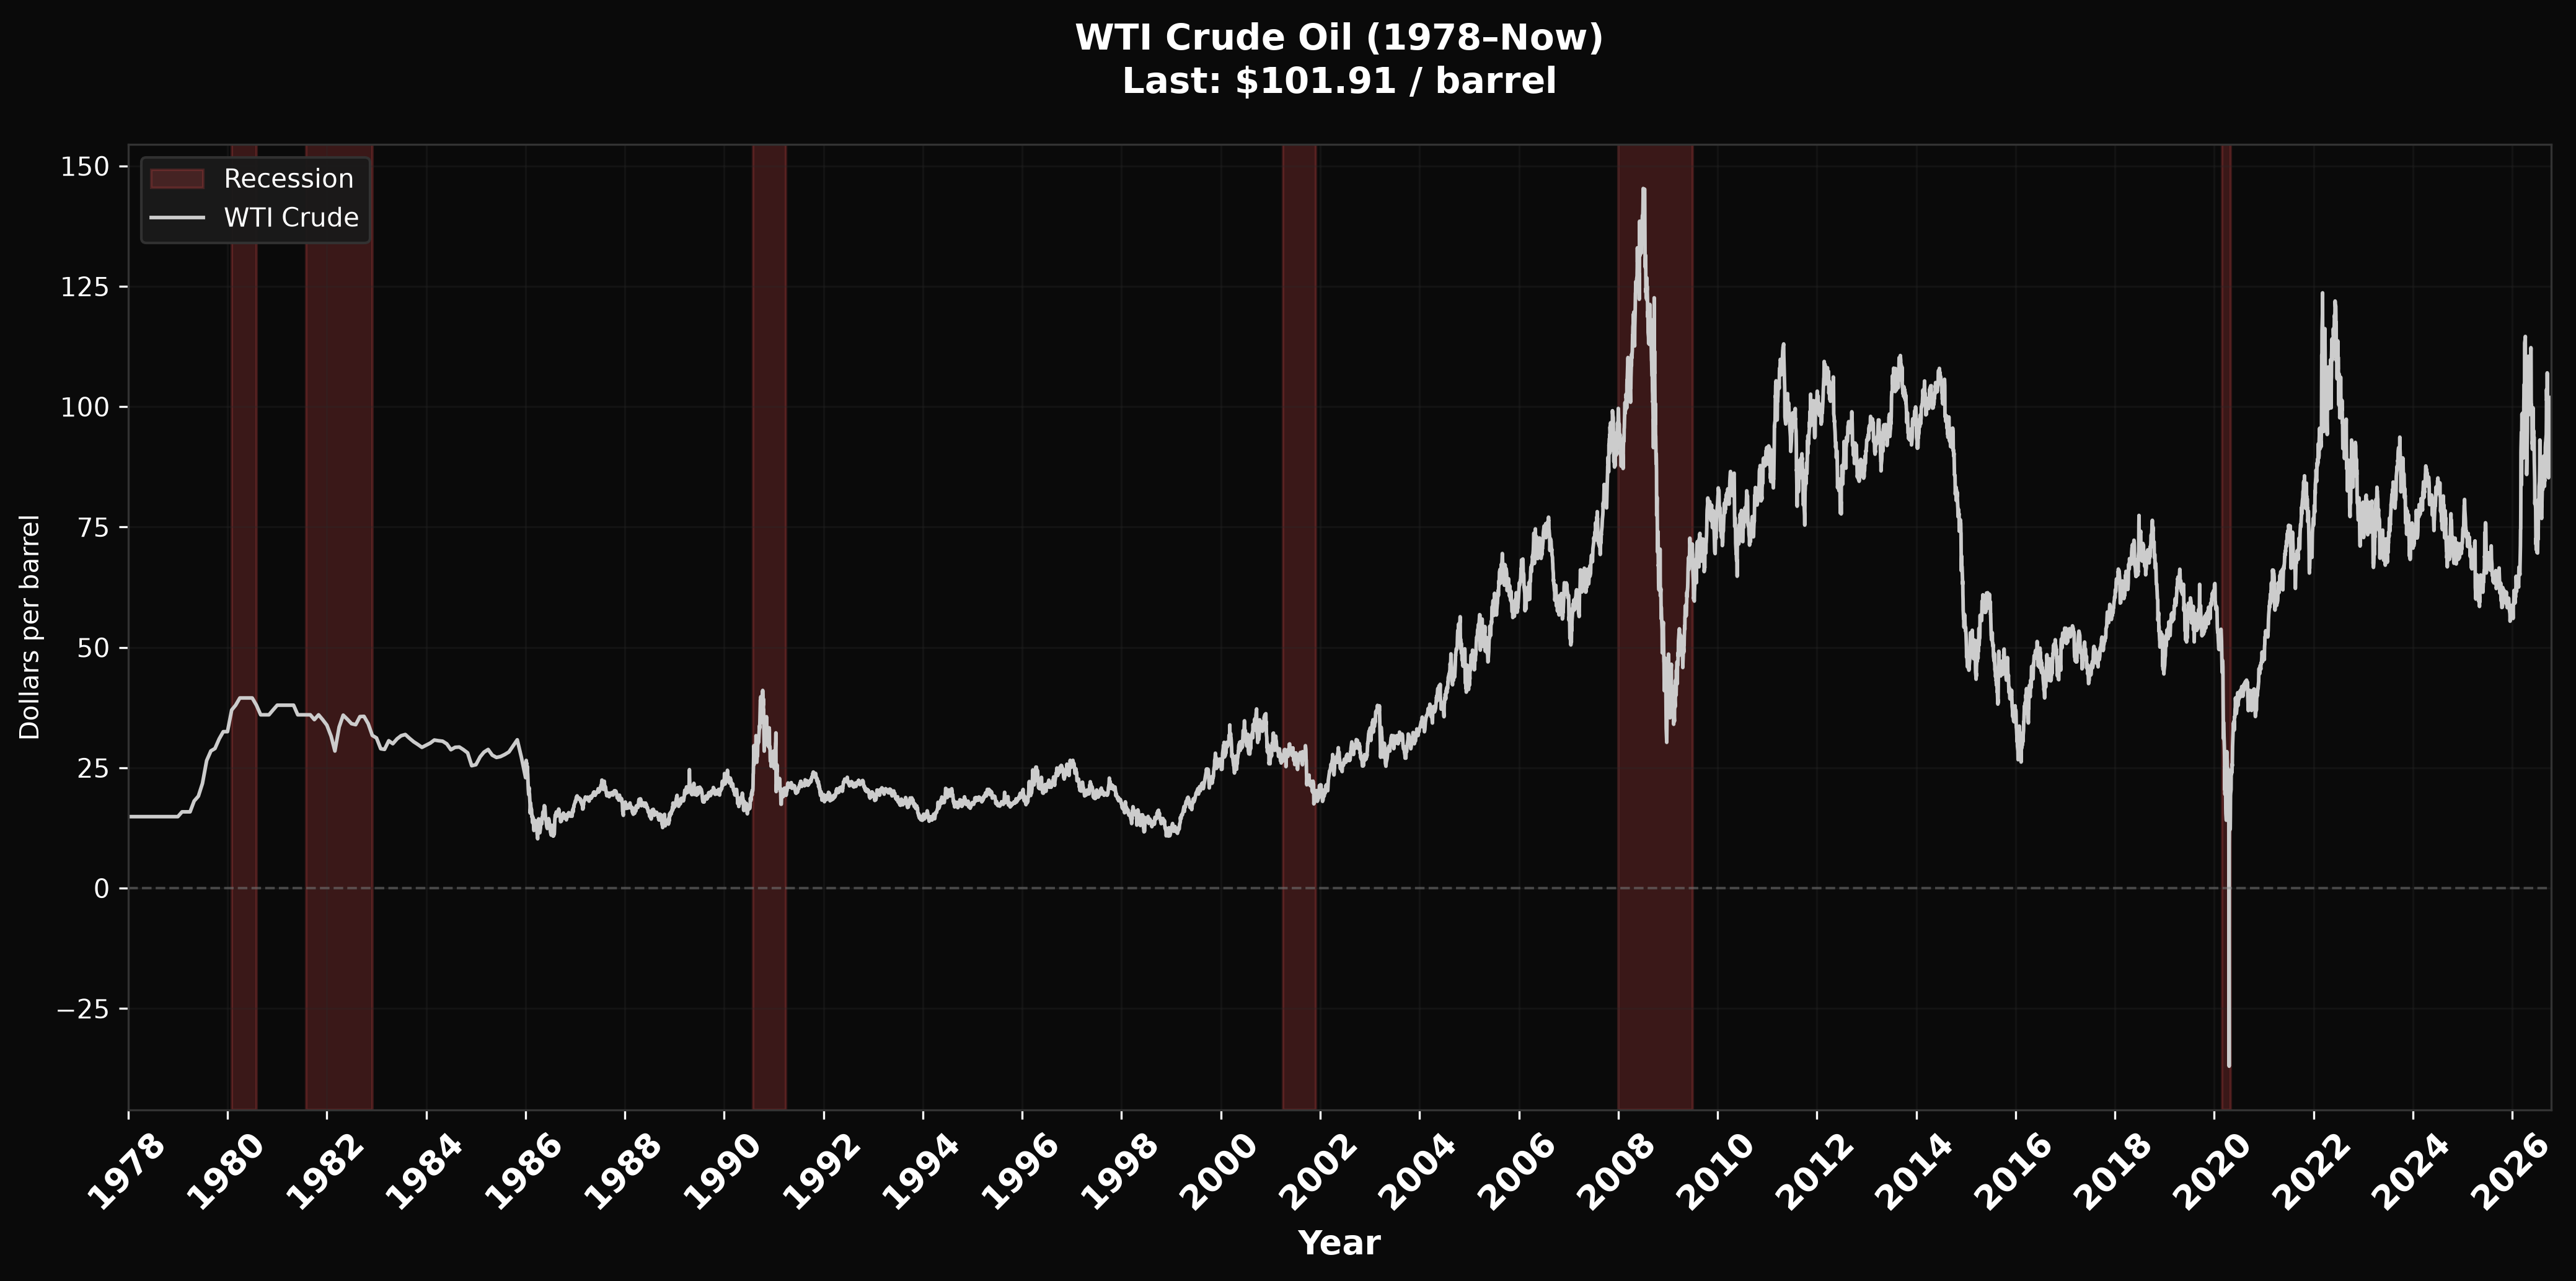
Dollars per barrel at Cushing. Energy costs show up in inflation, freight, and the price of running the real economy.
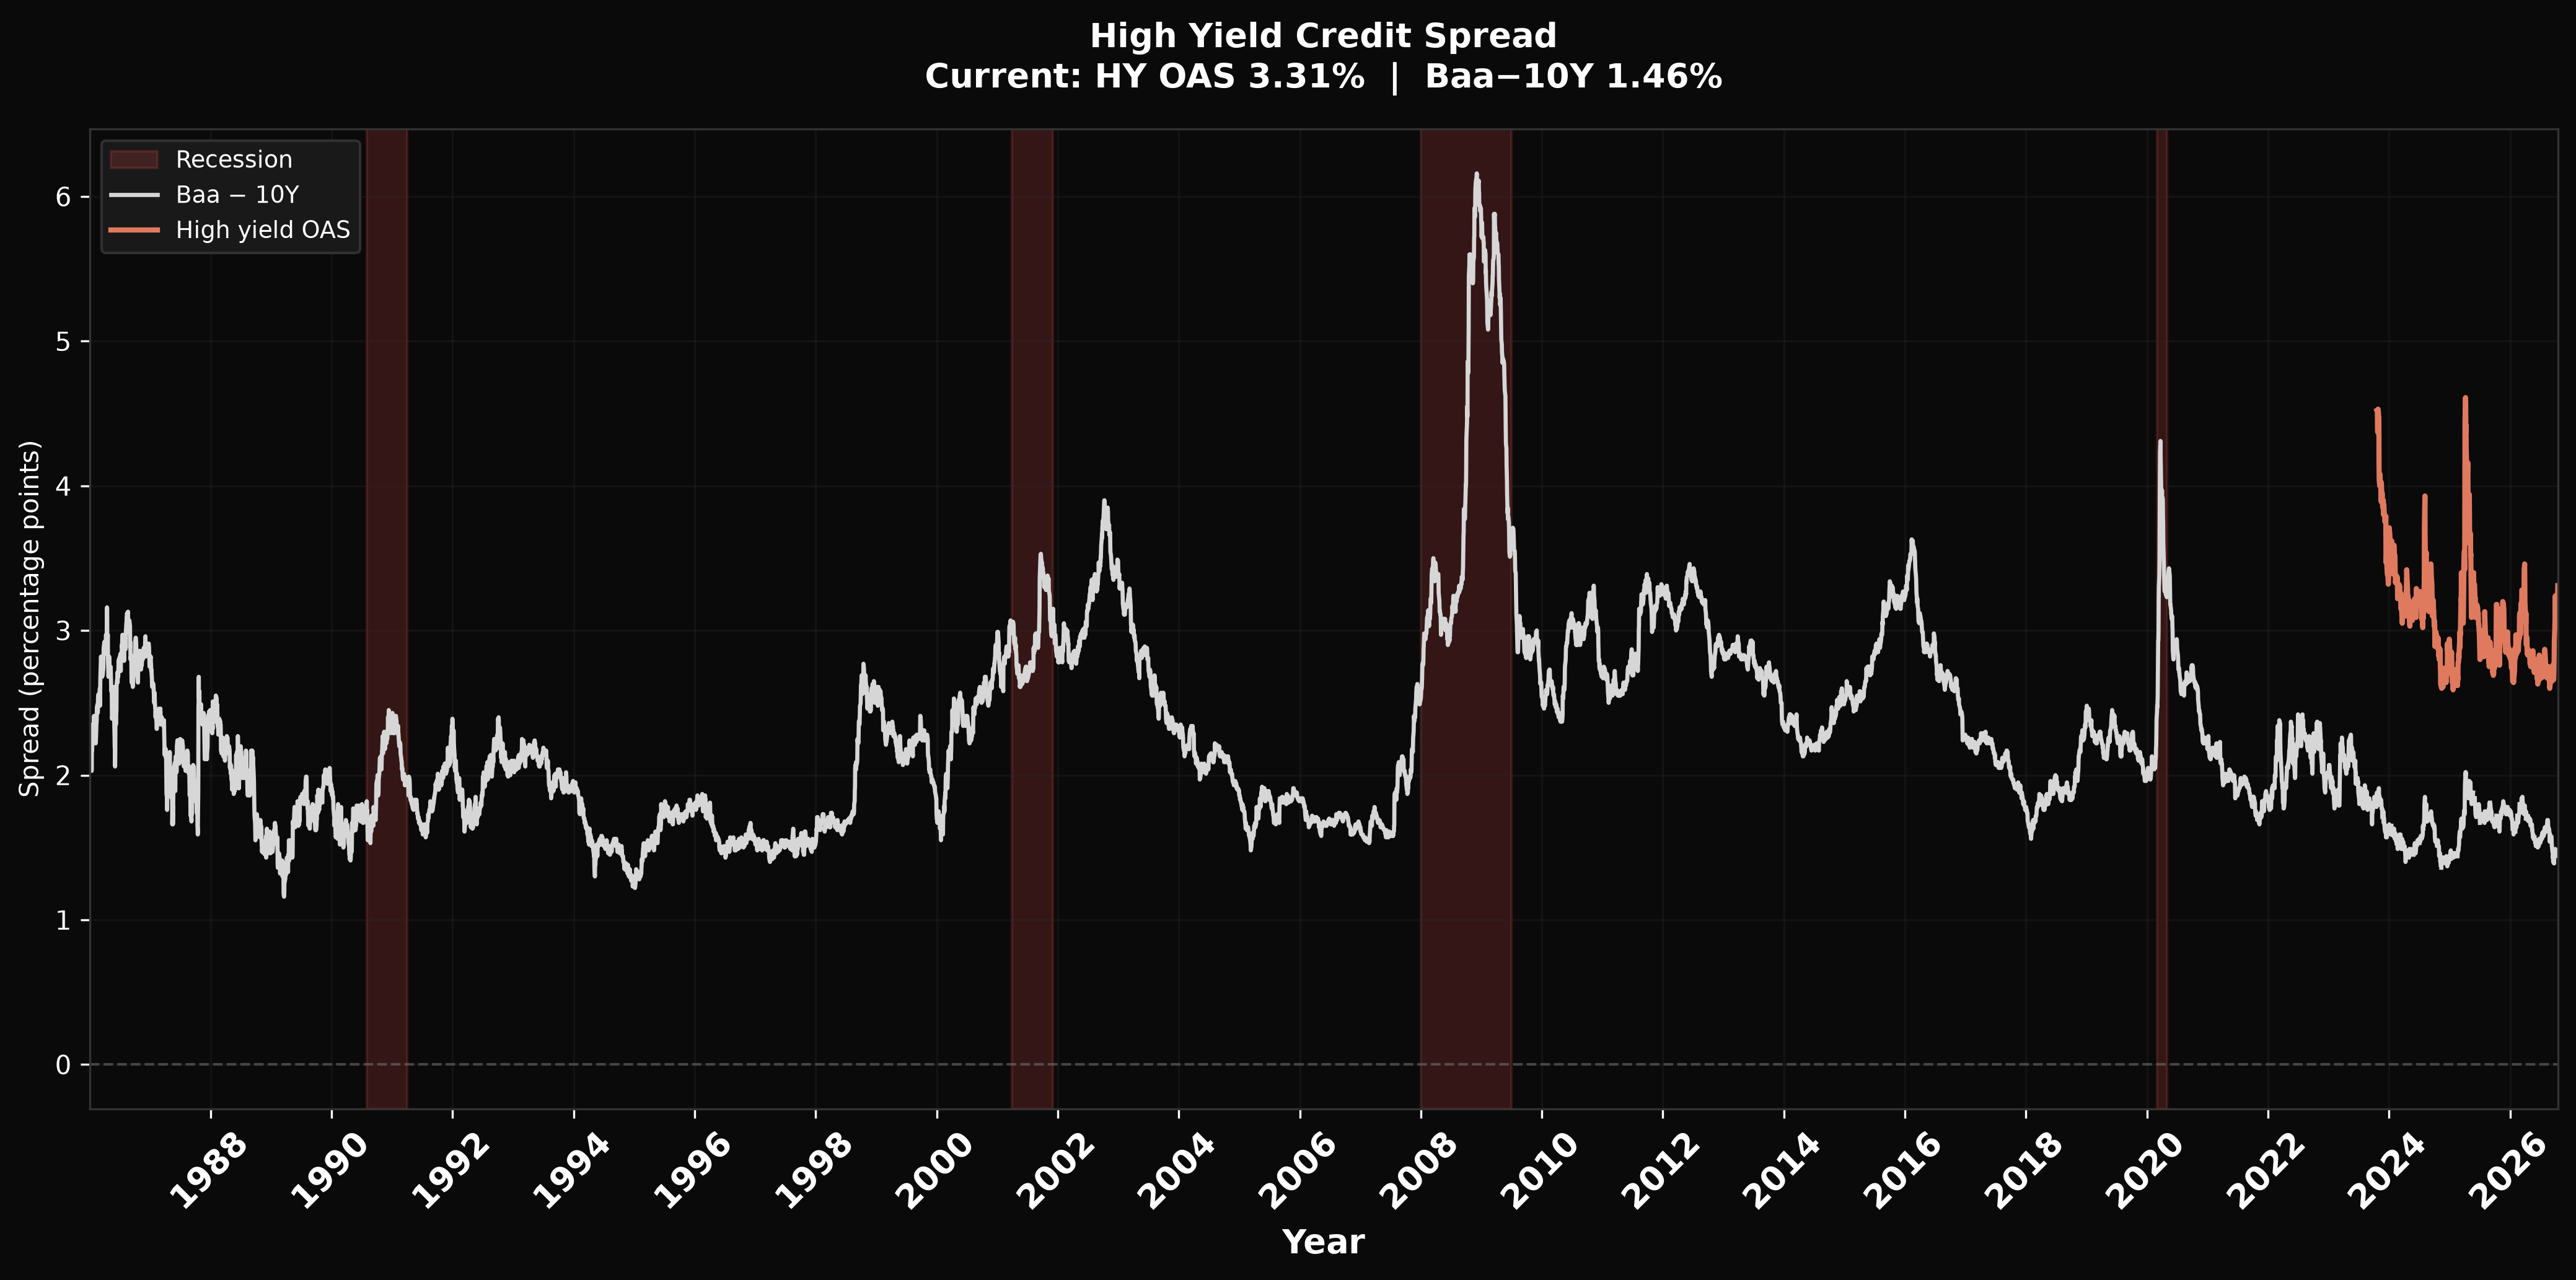
Extra yield lenders demand to hold company debt instead of Treasuries. Orange is junk (HY OAS); silver is Baa minus the 10-year.
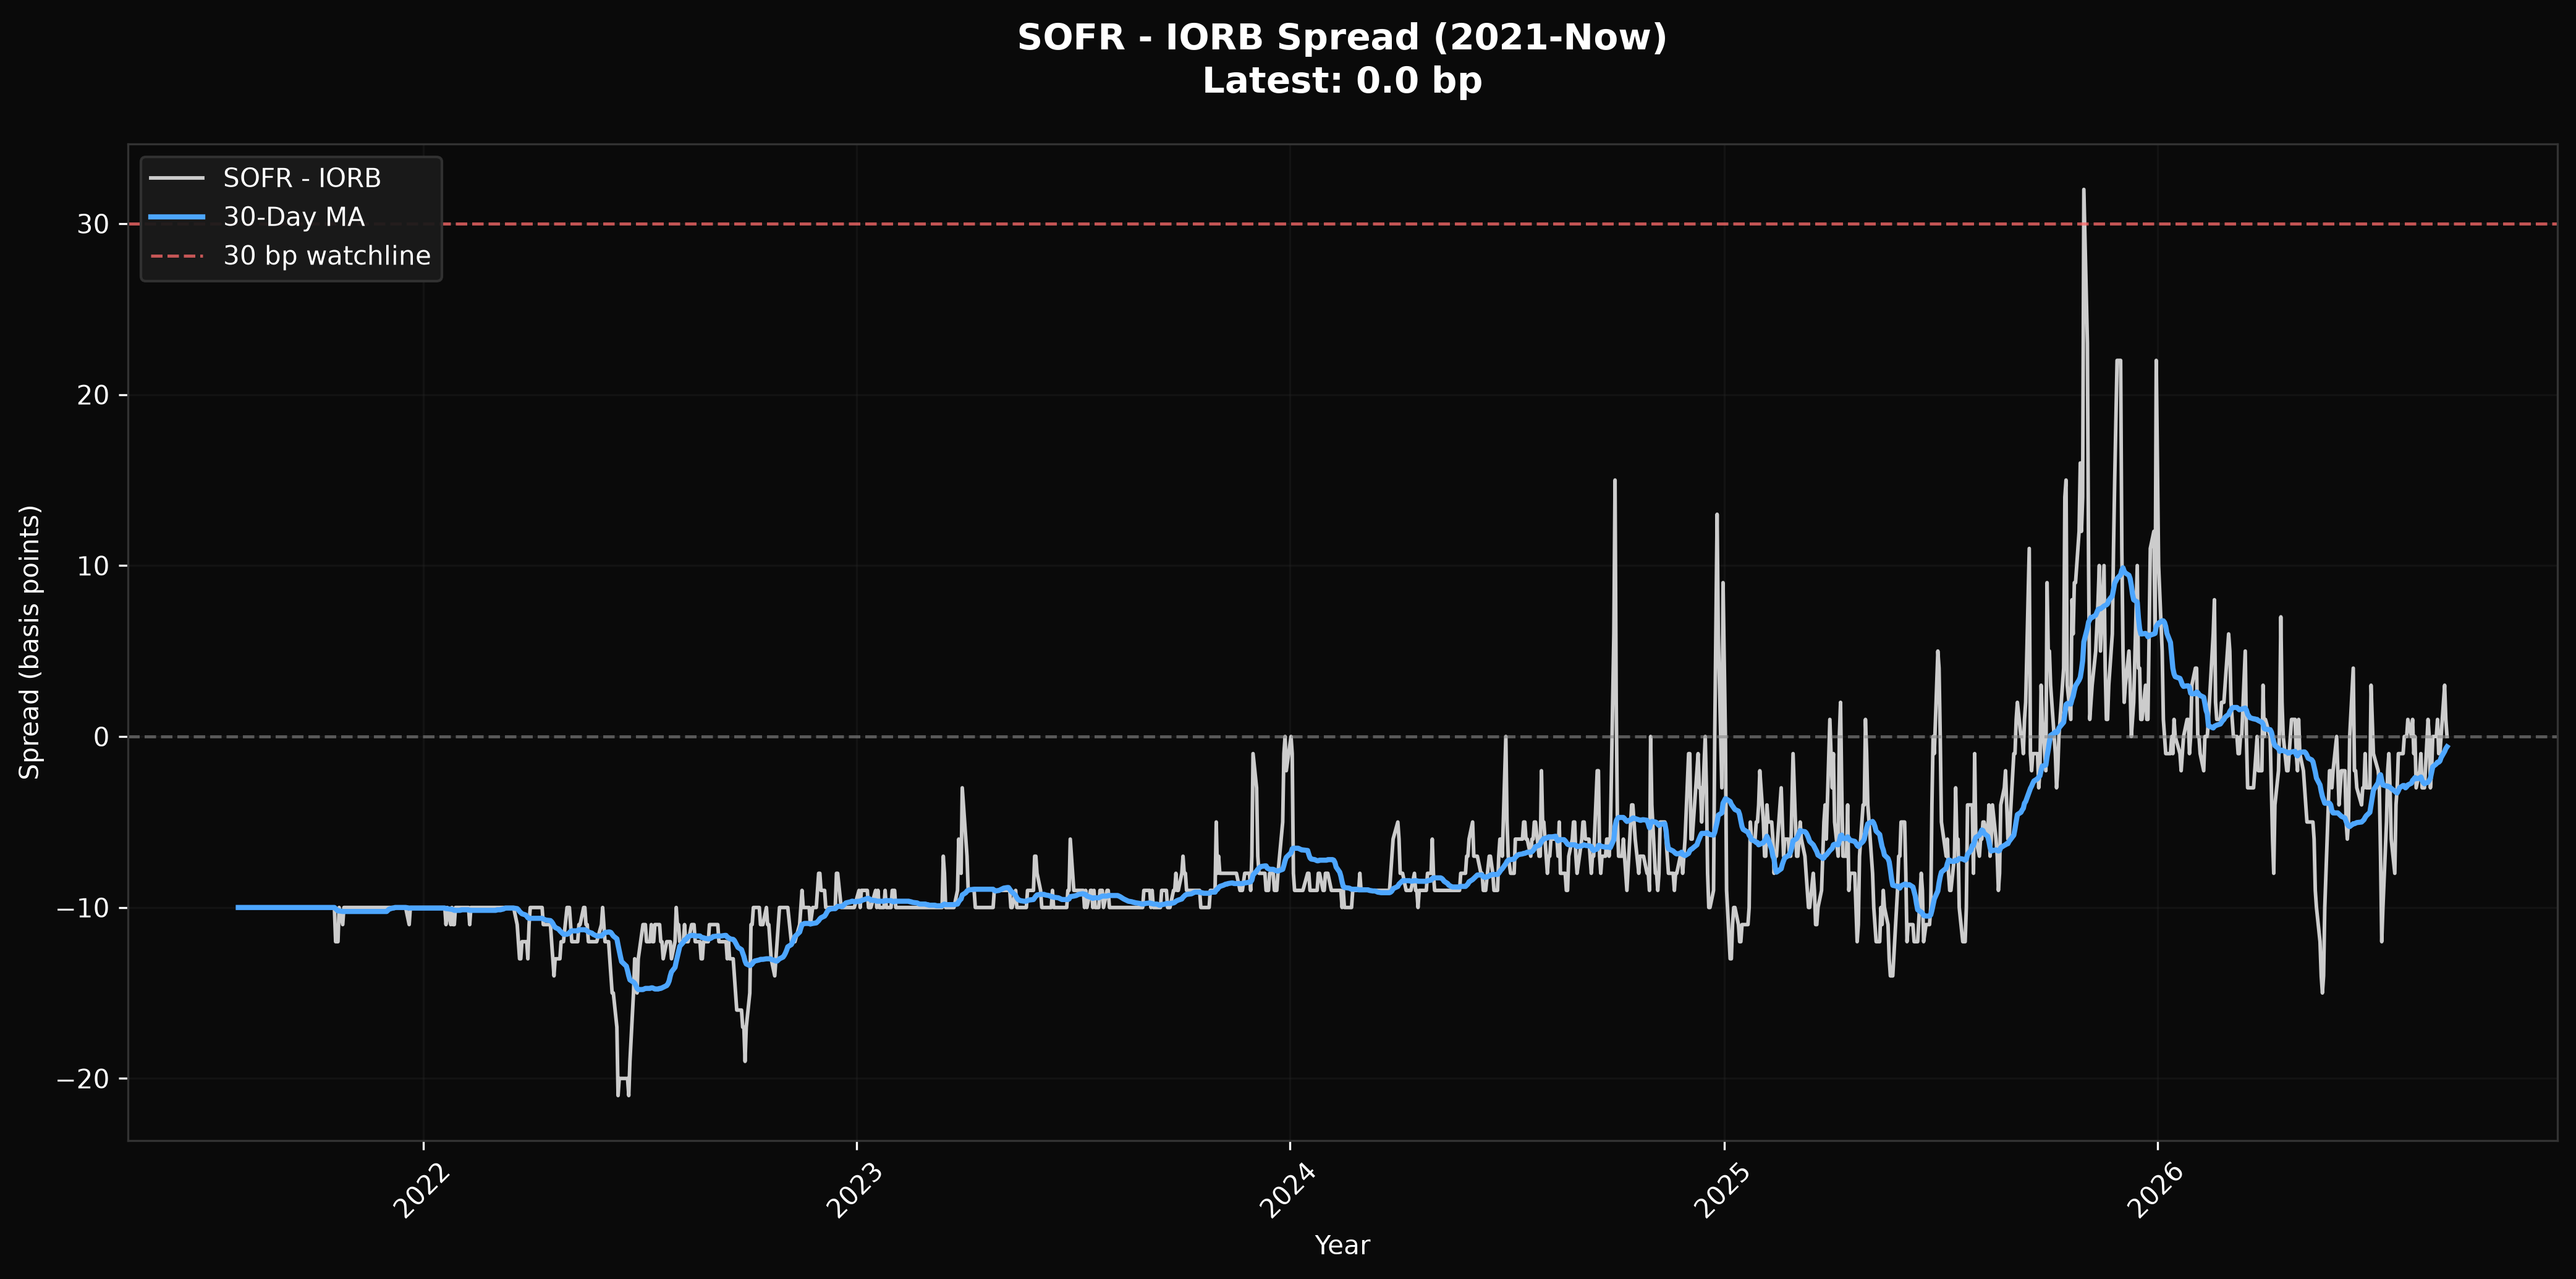
Overnight cash versus what the Fed pays banks to sit still. When this jumps, cash is getting scarce.
A series of graphs evaluating the pressure and dynamics of the US consumer.

The Sahm Rule flags recession risk when the three-month average unemployment rate has risen 0.5 points from its recent low. The unemployment rate is the share of people in the labor force who are actively looking for work but do not have a job. Less of a predictor and more of an indication that stress has hit U.S. households.
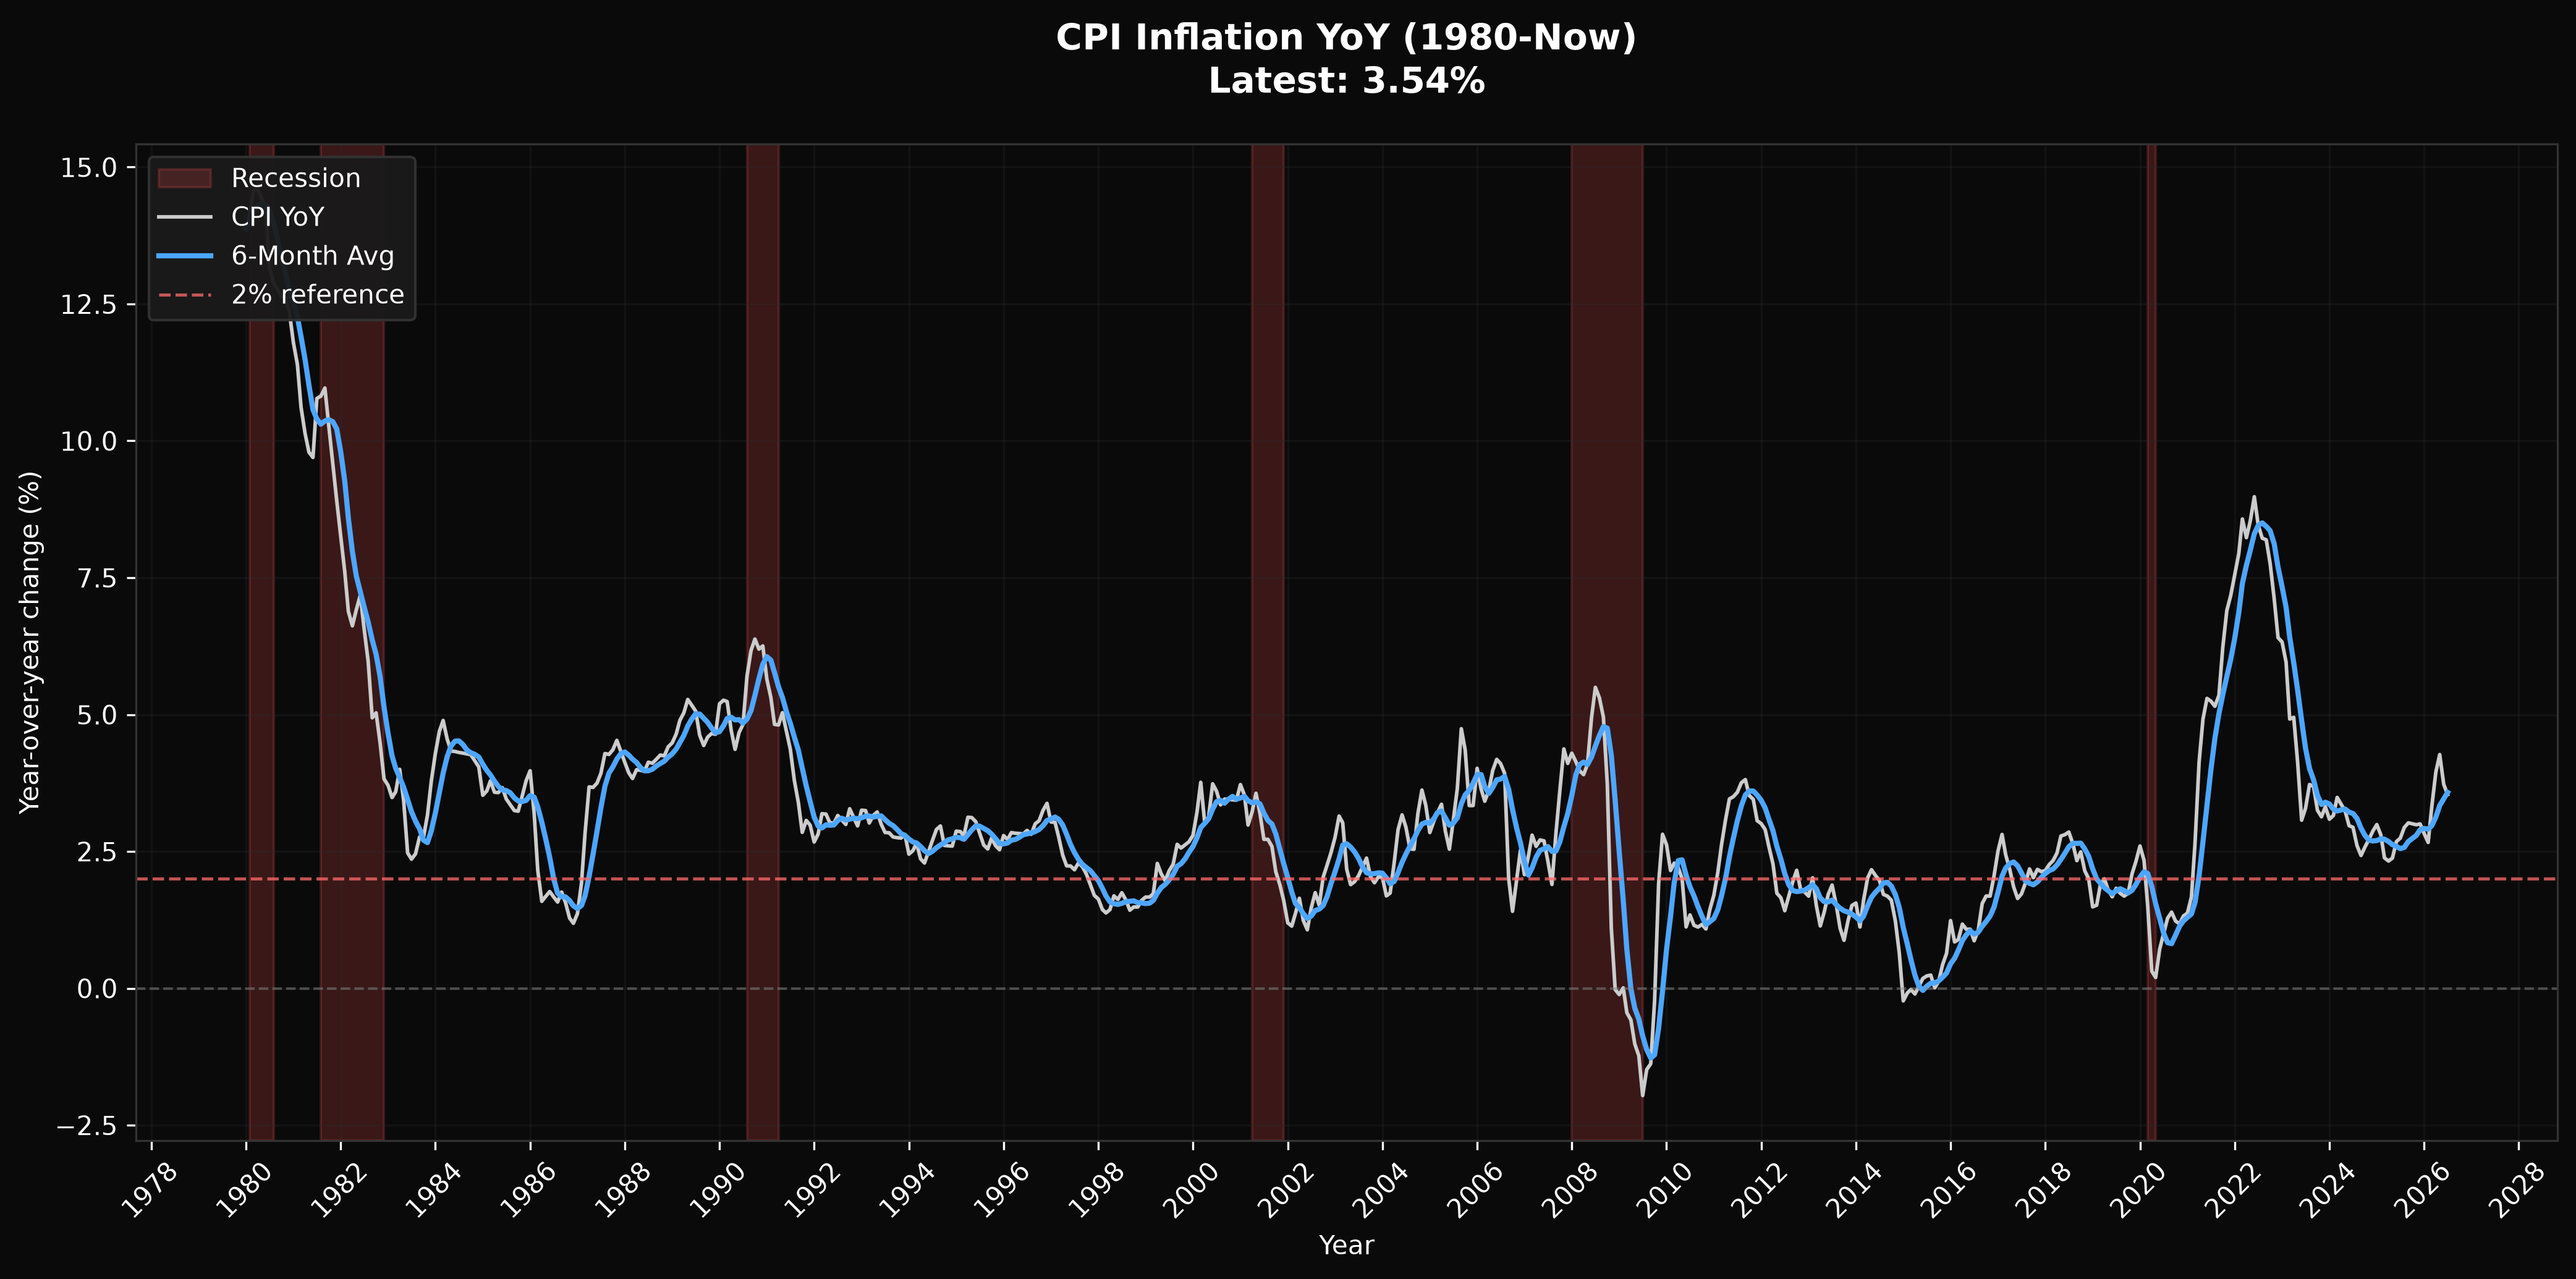
How fast a typical pile of stuff is getting more expensive. The government adds it up once a month.
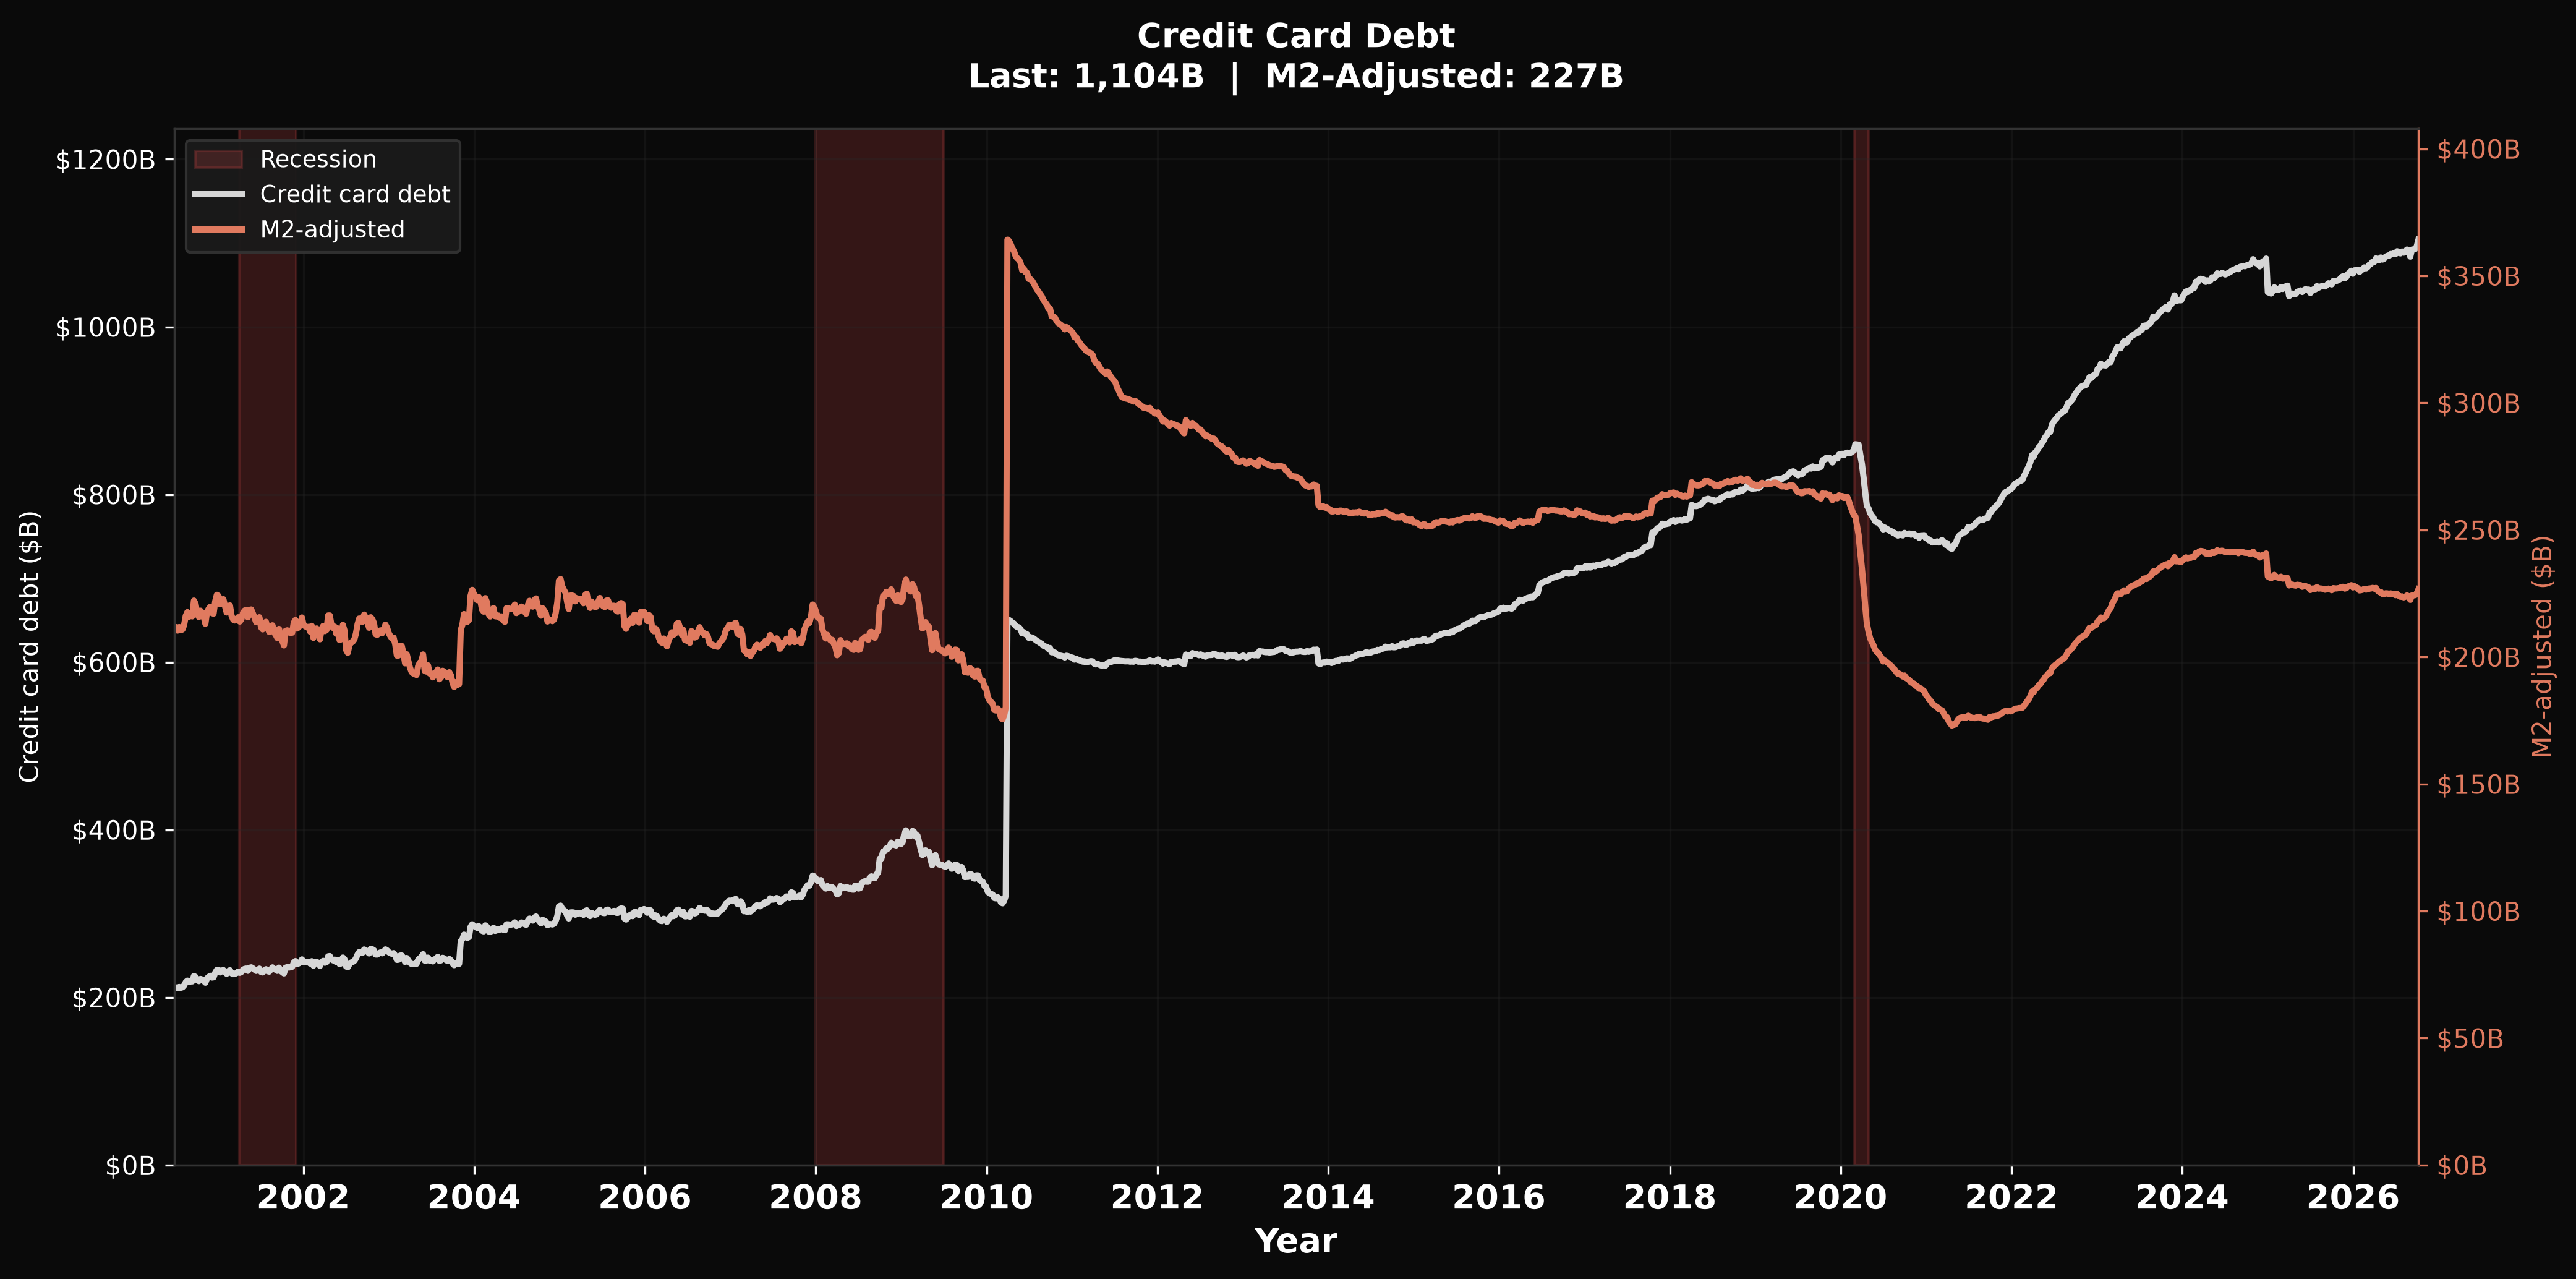
What households owe on bank cards. Orange line holds that pile still against M2 growth.
A series of graphs evaluating the pressure and dynamics of the US government.
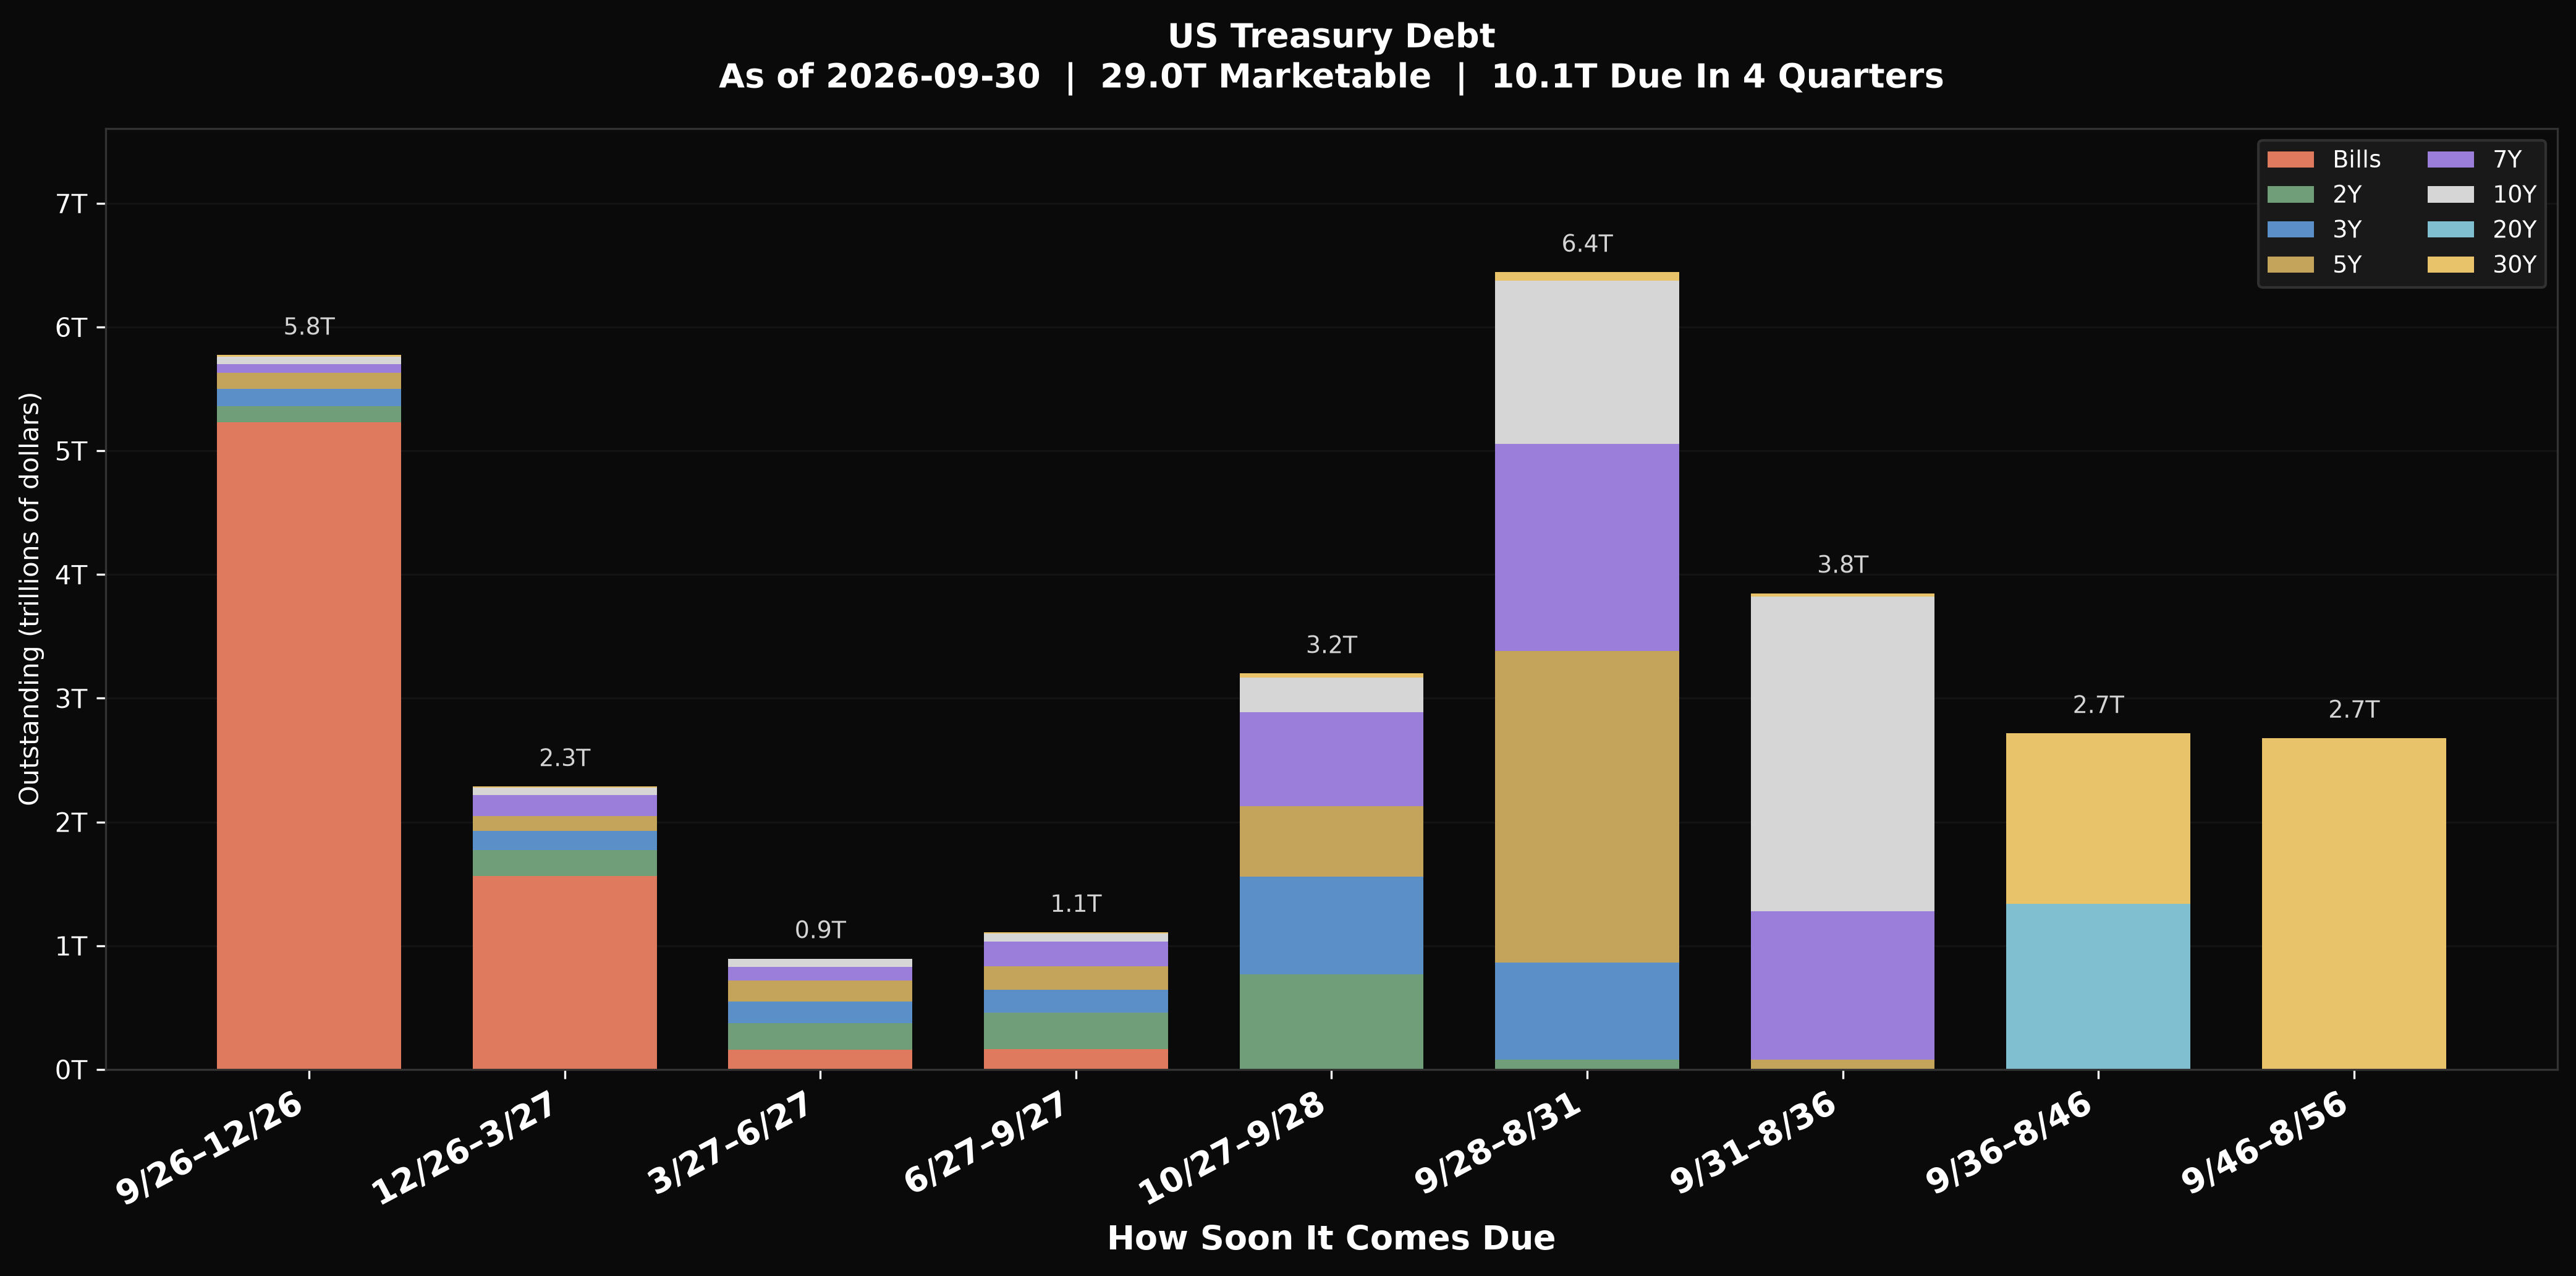
Each bar is a window of when Treasuries come due. Color is the original term — gold in the near window is old 30-year bonds almost due, not new 30-years. The left pile is the refinancing wall: that is how much Treasury has to roll soon, and it is where rate resets hit the budget first.
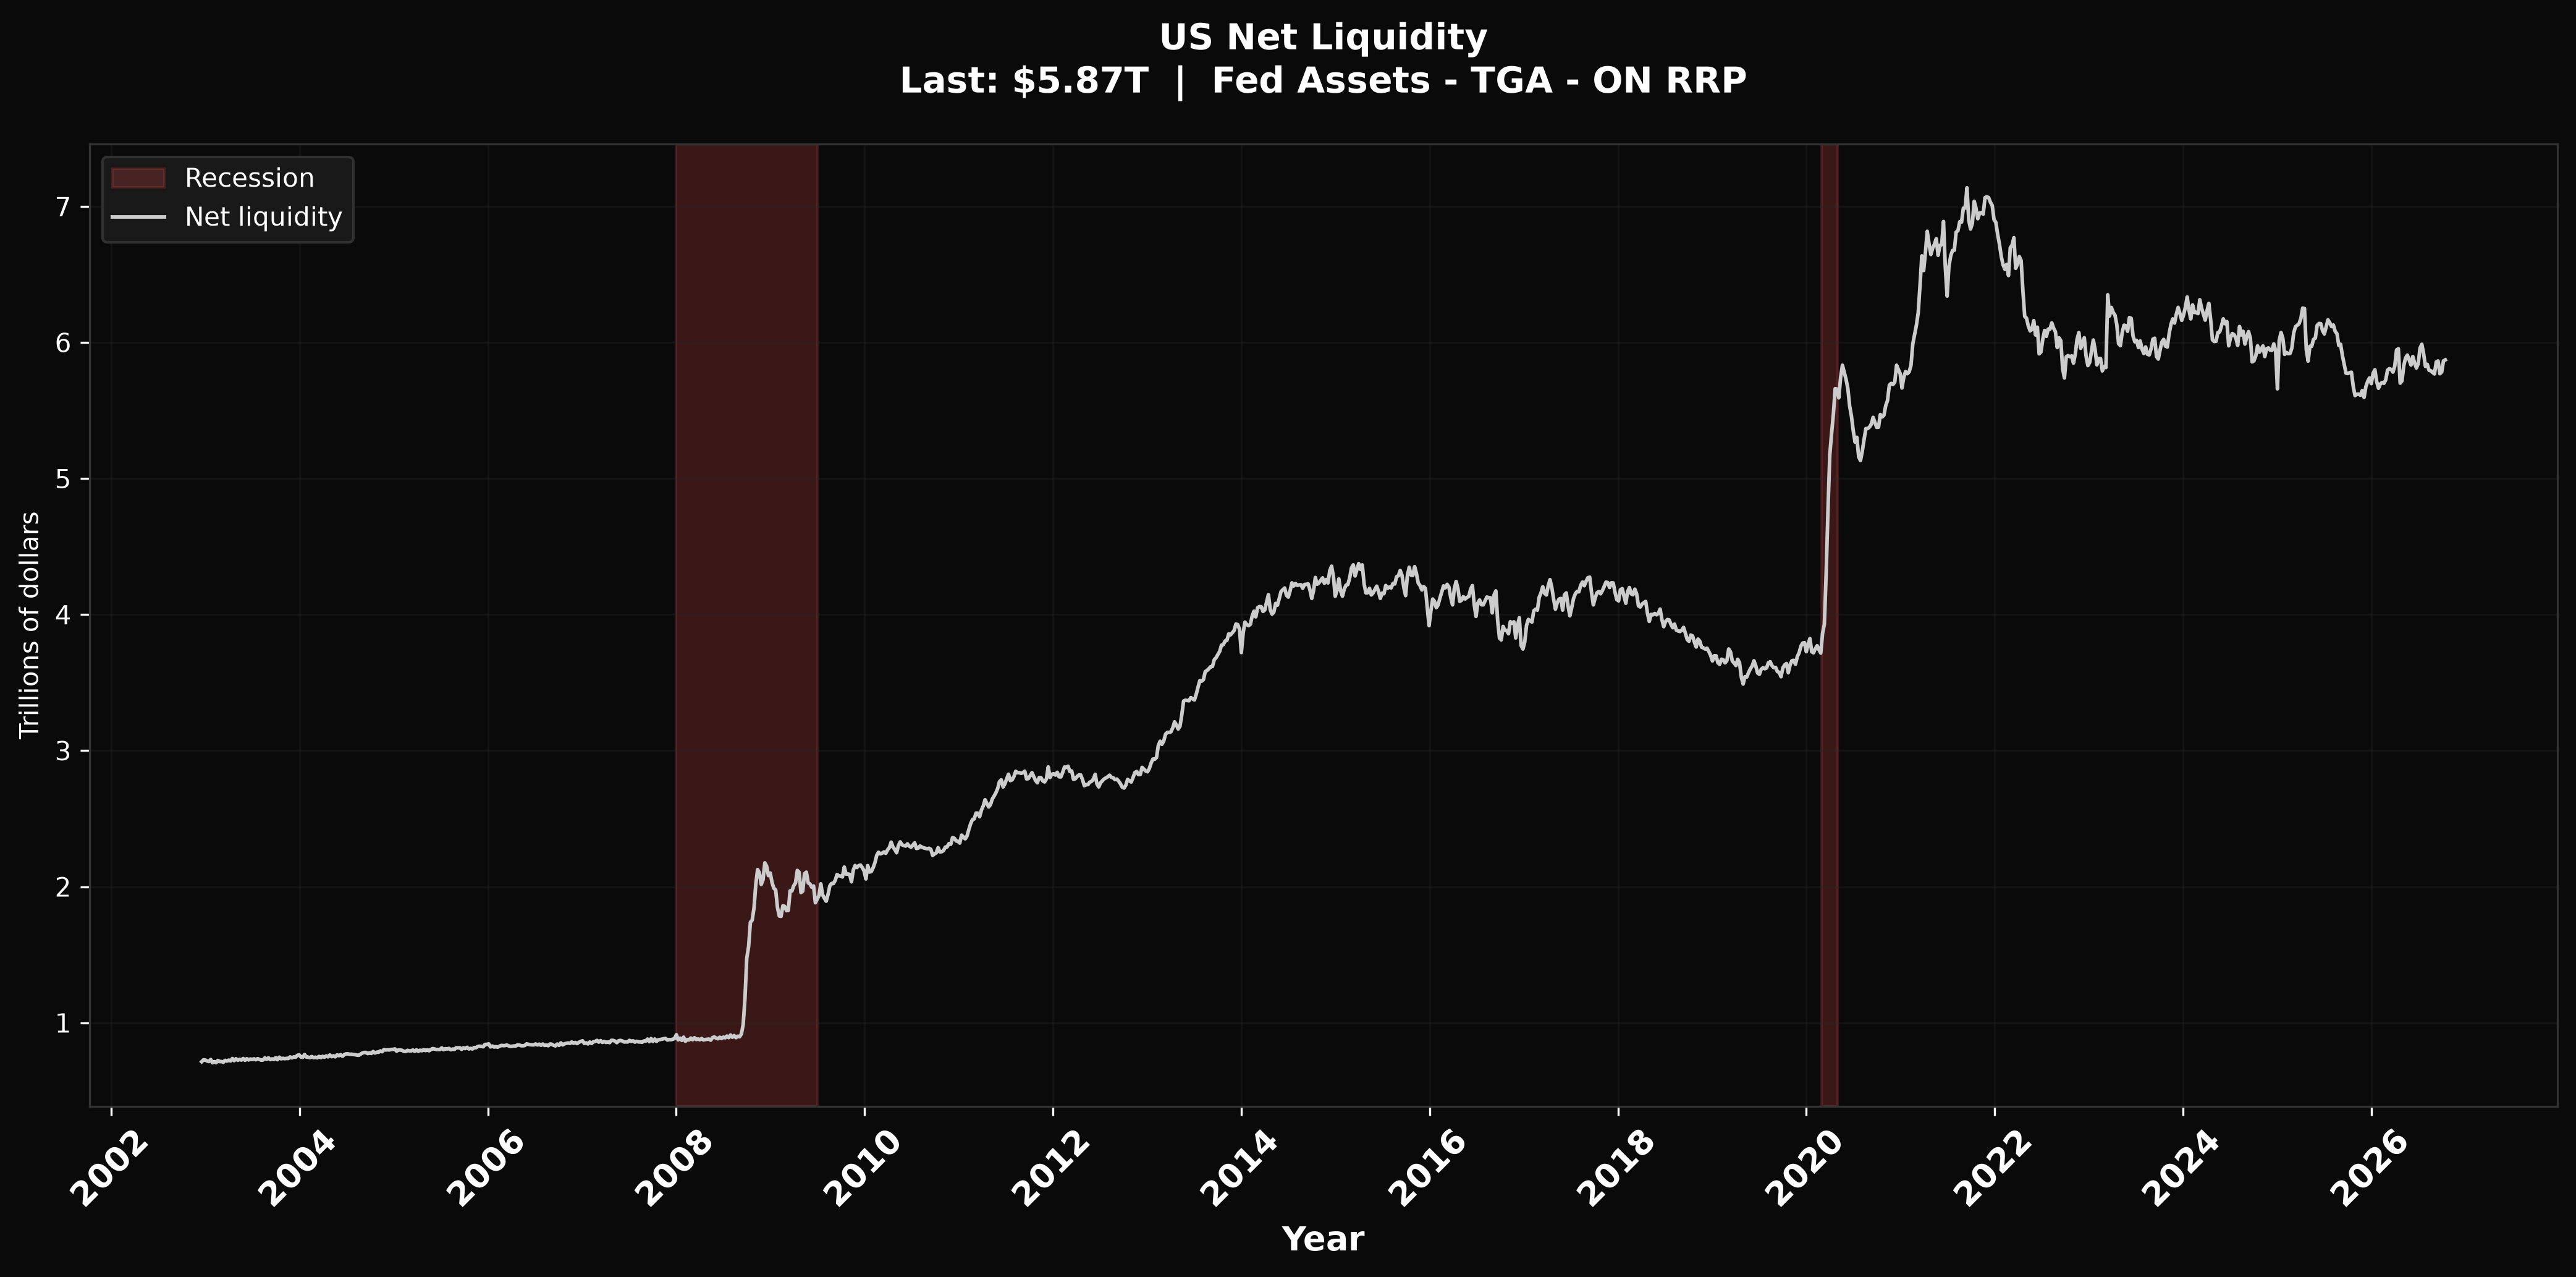
Fed assets minus cash parked at Treasury minus overnight RRP — the dollars actually loose in markets. Luke Gromen watches this as the true liquidity hose: when it rises, stocks, gold, and Bitcoin tend to catch a bid; when it falls, the dollar is draining and those trades get harder. Starts 2002.